Trade like A Pro. Trade With Confidence!
Getyourself ready to trade into the Forex market with excellence.
Account Leverage
1:1000
Minimum Deposit
$1
Trading Instruments
200+
Customer Service
7x24
Multi Market
Trading Experience
With multiple trading instruments, experience multiple trading opportunities with us.
Account Types
Maxain offers traders numerous opportunities to start trading according to their set goals.
Cent
$0
01
Minimum deposit
-
Leverage upto 1:400
-
Minimum spreads 1.3pips
-
Trading unit 0.01
-
Commissions No
-
Stop out 50%
Pro
$1
Minimum deposit
-
Leverage upto 1:1000
-
Minimum spreads 1.3pips
-
Trading unit 0.01
-
Commissions No
-
Stop out 50%
MOST POPULAR OPTION
ECN
$10000
Minimum deposit
-
Leverage upto 1:100
-
Minimum spreads 0.1pips
-
Trading unit 0.01
-
Commissions $7
-
Stop out 100%
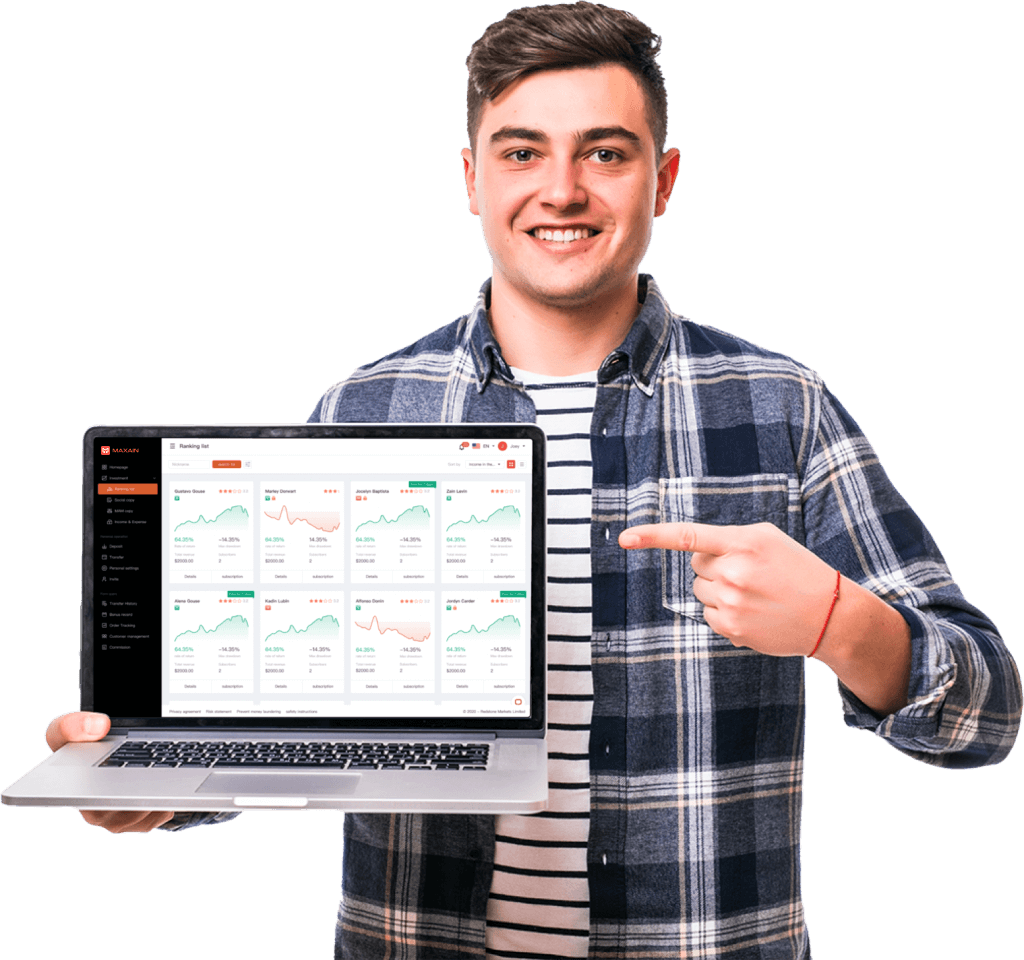
We know what you want
Fulfilling our client’s interest is what Maxain strives to offer.
Ultrafast Execution
With utmost accuracy and fine trading skills, Maxian strives in making all executions as fast as possible. Try it yourself!
Numerous Trading Instruments
With various trading instrument options, our clients can experience different trading opportunities through our single platform.
Clients First
Regardless of the account type or size of the investment, for Maxain, clients always come first. We work on strict values and that will never change.
Experience the best trading services in the town by yourself at Maxain and achieve the opportunity to earn unimaginable rewards.
With the assistance of our flexible partnership criteria, everyone has the chance to earn more than their expectations. However, our trading services and benefits have always been in the eyes of fellow traders.
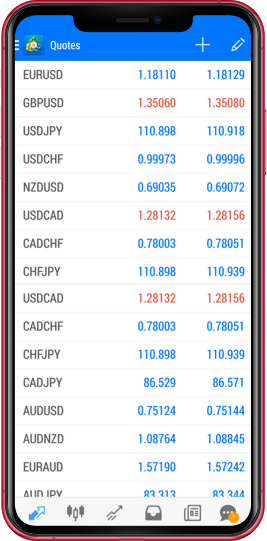
Download
Trading Platform
It’s time to grow your skills with Maxain free educational resources.
Ready to trade?
Unleash your trading skills with your Maxain account today!
Easy funding & withdrawals
No deposit fees