- 金は金曜日の早い時間、米国の消費者物価指数(CPI)と米・イランの和平交渉に注目が集まる中、おなじみのレンジで推移しています。.
- イスラエル・レバノン間の停戦合意はなく、慎重な楽観論の中、米ドルは足場を固める。.
- 金は、RSIが中立で、弱気のクロスが迫る中、木曜日に21日移動平均線を回復しました。.
金は金曜日のアジア取引で岐路に立たされており、米国のインフレ報告と米・イランの和平交渉を前に市場が慎重ながらも楽観的な見方を示す中、明確な方向性を見出そうとしています。.
金価格は、金曜日後半にパキスタンで予定されている米・イラン間の和平交渉への楽観的な見方から買いが入った。この楽観ムードが、金地金の下げを抑制している。.
しかし、3月の米国CPI(消費者物価指数)の急騰が予想されるため、売り手はまだ諦めていません。ウクライナ戦争によるエネルギー価格への影響が反映され、米連邦準備制度理事会(FRB)の金利見通しに関する期待が完全に再形成されるでしょう。.
水曜日に発表されたFOMC議事録によると、政策立案者は、FRBが年後半に利下げを再開すると引き続き予想していることが示されました。.
もし、データが利上げタカ派路線からの連邦準備制度理事会(FRB)の転換を示唆する兆候を示せば、利息のつかない金は激しい売り圧力にさらされる可能性がある。.
一方、中東危機でインフレ率の上昇を一過性のものと見なして市場が無視すれば、インフレ懸念が後退し、FRBの年内利下げ観測が維持される可能性があります。このシナリオは、金(ゴールド)の買い手にとってブレイクアウトの引き金となり得ます。.
とはいえ、米国とイランの平和交渉とその見通しを巡るセンチメントが、米国インフレ率のデータへの反応を限定的、あるいは相殺する可能性もある。.
その間、イスラエルとレバノンの紛争のエスカレーションの欠如は、投資家を不安にさせ、米国ドルへの避難需要を維持させている。.
そのため、金は金曜日の取引序盤で引き続き慎重な取引をしており、トレーダーは新たな方向性への賭けを控えています。.
日々のテクニカル分析
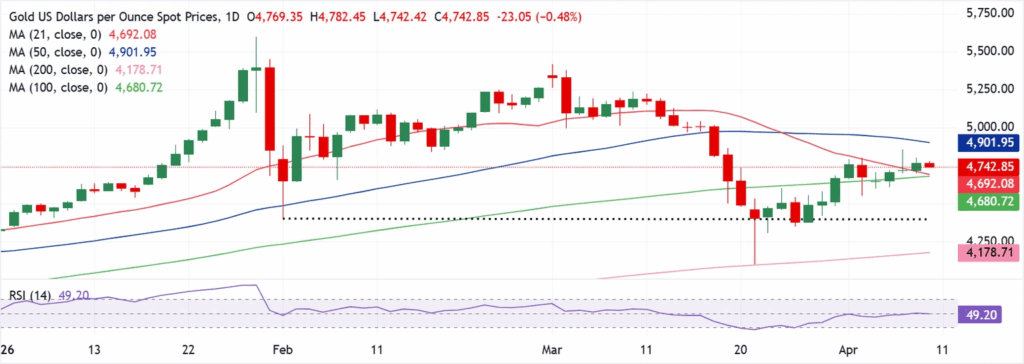
日足チャートでは、XAU/USD は $4,742.85 で取引されており、短期および中期トレンドシグナルの間でスポットが統合されることに伴い、中立的な短期バイアスを維持しています。価格は $4,692.08 の 21 日移動平均線と $4,680.72 の 100 日移動平均線の上に留まっています。これらの移動平均線は、下落局面での根強い需要を示唆していますが、 $4,901.95 の 50 日移動平均線の下に抑えられ、上値の伸びを制限しています。 $4,178.71 の 200 日移動平均線は、より広範な強気構造を引き続き下支えしており、 49.2 付近で推移する相対力指数(14)は、買い手と売り手のどちらも明確に支配していない、均衡したモメンタムを反映しています。.
しかし、21日移動平均線が100日移動平均線を上からクロスしようとしているため、リスクは下方向優位に見えます。これが日足終値で実現した場合、弱気バイアスが確認されます。.
一方で、初期のサポートは$4,692付近の21日移動平均線に見られ、それに100日移動平均線が$4,681付近で続きます。これにより、もしブレークされた場合に$4,179の200日移動平均線周辺のより深い中期的なフロアを露呈する、近くの需要帯を形成します。トップサイドでは、$4,902付近の50日移動平均線が直近のレジスタンスとなります。このバリアーを越えて日足でクローズすることが、強気な勢いを復活させ、より持続的な回復フェーズへの道を開くために必要となります。.
米国CPIと米・イラン平和交渉が迫る中、金の売り手はまだ諦めない
金は金曜日のアジア取引で岐路に立たされており、米国のインフレ報告と米・イランの和平交渉を前に市場が慎重ながらも楽観的な見方を示す中、明確な方向性を見出そうとしています。.
金価格は、金曜日後半にパキスタンで予定されている米・イラン間の和平交渉への楽観的な見方から買いが入った。この楽観ムードが、金地金の下げを抑制している。.
しかし、3月の米国CPI(消費者物価指数)の急騰が予想されるため、売り手はまだ諦めていません。ウクライナ戦争によるエネルギー価格への影響が反映され、米連邦準備制度理事会(FRB)の金利見通しに関する期待が完全に再形成されるでしょう。.
水曜日に発表されたFOMC議事録によると、政策立案者は、FRBが年後半に利下げを再開すると引き続き予想していることが示されました。.
もし、データが利上げタカ派路線からの連邦準備制度理事会(FRB)の転換を示唆する兆候を示せば、利息のつかない金は激しい売り圧力にさらされる可能性がある。.
一方、中東危機でインフレ率の上昇を一過性のものと見なして市場が無視すれば、インフレ懸念が後退し、FRBの年内利下げ観測が維持される可能性があります。このシナリオは、金(ゴールド)の買い手にとってブレイクアウトの引き金となり得ます。.
とはいえ、米国とイランの平和交渉とその見通しを巡るセンチメントが、米国インフレ率のデータへの反応を限定的、あるいは相殺する可能性もある。.
その間、イスラエルとレバノンの紛争のエスカレーションの欠如は、投資家を不安にさせ、米国ドルへの避難需要を維持させている。.
そのため、金は金曜日の取引序盤で引き続き慎重な取引をしており、トレーダーは新たな方向性への賭けを控えています。.
日々のテクニカル分析
日足チャートでは、XAU/USD は $4,742.85 で取引されており、短期および中期トレンドシグナルの間でスポットが統合されることに伴い、中立的な短期バイアスを維持しています。価格は $4,692.08 の 21 日移動平均線と $4,680.72 の 100 日移動平均線の上に留まっています。これらの移動平均線は、下落局面での根強い需要を示唆していますが、 $4,901.95 の 50 日移動平均線の下に抑えられ、上値の伸びを制限しています。 $4,178.71 の 200 日移動平均線は、より広範な強気構造を引き続き下支えしており、 49.2 付近で推移する相対力指数(14)は、買い手と売り手のどちらも明確に支配していない、均衡したモメンタムを反映しています。.
しかし、21日移動平均線が100日移動平均線を上からクロスしようとしているため、リスクは下方向優位に見えます。これが日足終値で実現した場合、弱気バイアスが確認されます。.
一方で、初期のサポートは$4,692付近の21日移動平均線に見られ、それに100日移動平均線が$4,681付近で続きます。これにより、もしブレークされた場合に$4,179の200日移動平均線周辺のより深い中期的なフロアを露呈する、近くの需要帯を形成します。トップサイドでは、$4,902付近の50日移動平均線が直近のレジスタンスとなります。このバリアーを越えて日足でクローズすることが、強気な勢いを復活させ、より持続的な回復フェーズへの道を開くために必要となります。.
カテゴリー
最近の投稿
【XAU/USD】FOMC週を前に弱気バイアスが続く
中東紛争の拡大でXAU/USDは岐路に立たされている
原油価格の上昇が続く中、力強い回復が障害に直面する可能性
この記事が気に入りましたか?シェアする
トレードの準備はいいか?
今すぐMaxain口座であなたのトレーディングスキルを発揮してください!
簡単な資金調達 引き出し
保証金なし