- 週一早盤,金價徘徊在$4,300美元附近,接近三個月低點,此前週五曾出現3.25%的拋售潮。.
- 美元指數在續增的中東緊張局勢和聯準會升息預期中守住 100.00 關卡之上。.
- 上週金價收盤跌破關鍵的200日移動平均線;測試$4,250區間的可能性依然存在。.
黃金正處於舔舐傷口之際,週一在亞洲時段徘徊於$4,300美元的近三個月低點附近。隨著中東局勢再度升溫,加上市場預期美國聯邦儲備委員會(Fed)將採取鷹派立場,這項貴金屬正處於盤整階段,隨後可能延續上週五的拋售走勢。.
儘管金價溫和反彈,但鑑於近期技術面破位以及以色列和伊朗之間的舊敵再燃,黃金仍面臨下行風險。.
星期日,以色列自美國上週宣布黎巴嫩停火以來,首次對貝魯特地區發動襲擊,而真主黨則斷然拒絕該停火協議。.
伊朗以打击以色列作为报复,并以美国持续的海上封锁以及以色列袭击贝鲁特为由,称这是违反德黑兰和华盛顿之间达成的停火协议。.
從那時起,以色列和伊朗便互相展開攻擊,中東地區的敵對行動再次升溫,儘管美國總統唐納·川普曾急切敦促以色列總理班傑明·納坦雅胡不要立即報復伊朗先前對以色列發射的飛彈,根據多家媒體的報導。.
此外,還有報導稱伊朗和葉門正在向以色列發射飛彈。.
中東戰火再燃,推升油價,加劇黃金頹勢。金價此前已因週五公佈的強勁美國非農就業報告打擊而跌跌不休。.
5月份非農就業人口(NFP)增加17.2萬個職位,高於預期的8.5萬個新增職位;而3月和4月的就業人數增幅則上修9.3萬個。失業率連續第三個月維持在4.31%(四週移動平均值)。.
根據芝加哥商品交易所集團(CME Group)的FedWatch工具顯示,市場目前預估聯準會今年年底前升息的機率約為70%,高於非農就業報告(NFP)發布前的略高於50%。.
美國勞動力市場的韌性以及油價飆升引發的通膨擔憂,完美地為黃金加劇的看跌勢頭創造了條件。.
展望後市,由於美元對日圓匯率再次逼近 160.50 關口(官方曾在 4 月下旬在此水平進行干預),黃金交易員密切關注中東局勢發展以及潛在的日本干預風險。.
總體而言,展望未來,貴金屬的波動性預計仍將居高不下,賣方可能會藉機大舉賣出,而「逢高賣出」的交易將佔主導地位。.
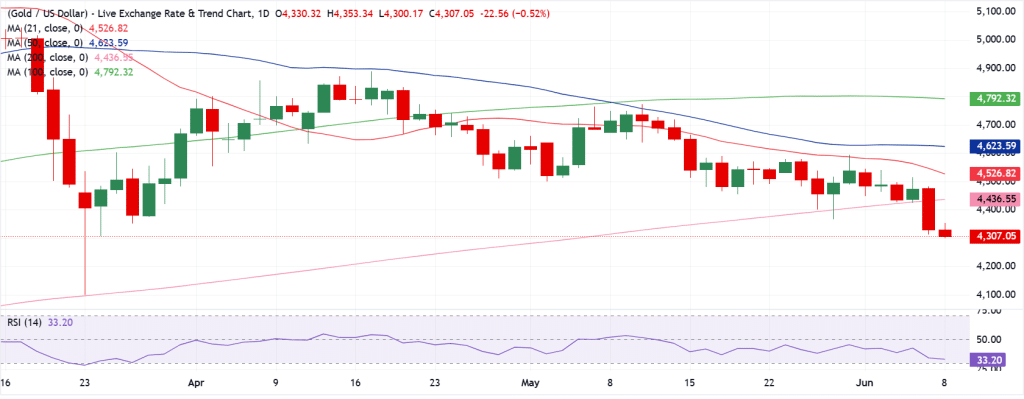
在日線圖上,XAU/USD 報 $4,307.05,由於現貨價格持續盤踞於所有主要移動平均線之下,空頭走勢得以延續。 21日簡單移動平均線(SMA)約位於$4,526.82,50日SMA接近$4,623.59,100日SMA位於$4,792.32,甚至更長期的200日SMA位於$4,436.55,均位於價格上方,強化了偏向下行的結構,儘管相對強弱指數(14)正滑向30點區間的低位,暗示可能出現超賣狀況,而非已確認的反轉。.
在上行方向,初步阻力位由位於 $4,436.55 的 200 日均線所界定,而位於 $4,526.82,以及位於$4,623.59的50日均線,共同形成後續阻力區間;而更高處的100日均線位於$4,792.32,則標示出更遠的阻力關口。 由於現貨價格下方缺乏鄰近的移動平均線支撐,在買方至少能收復200日均線並開始緩解沉重的技術面壓力之前,該金屬仍容易面臨進一步下行風險。.
繼中東戰事重燃,XAU/USD 恐面臨更多跌勢
黃金正處於舔舐傷口之際,週一在亞洲時段徘徊於$4,300美元的近三個月低點附近。隨著中東局勢再度升溫,加上市場預期美國聯邦儲備委員會(Fed)將採取鷹派立場,這項貴金屬正處於盤整階段,隨後可能延續上週五的拋售走勢。.
儘管金價溫和反彈,但鑑於近期技術面破位以及以色列和伊朗之間的舊敵再燃,黃金仍面臨下行風險。.
星期日,以色列自美國上週宣布黎巴嫩停火以來,首次對貝魯特地區發動襲擊,而真主黨則斷然拒絕該停火協議。.
伊朗以打击以色列作为报复,并以美国持续的海上封锁以及以色列袭击贝鲁特为由,称这是违反德黑兰和华盛顿之间达成的停火协议。.
從那時起,以色列和伊朗便互相展開攻擊,中東地區的敵對行動再次升溫,儘管美國總統唐納·川普曾急切敦促以色列總理班傑明·納坦雅胡不要立即報復伊朗先前對以色列發射的飛彈,根據多家媒體的報導。.
此外,還有報導稱伊朗和葉門正在向以色列發射飛彈。.
中東戰火再燃,推升油價,加劇黃金頹勢。金價此前已因週五公佈的強勁美國非農就業報告打擊而跌跌不休。.
5月份非農就業人口(NFP)增加17.2萬個職位,高於預期的8.5萬個新增職位;而3月和4月的就業人數增幅則上修9.3萬個。失業率連續第三個月維持在4.31%(四週移動平均值)。.
根據芝加哥商品交易所集團(CME Group)的FedWatch工具顯示,市場目前預估聯準會今年年底前升息的機率約為70%,高於非農就業報告(NFP)發布前的略高於50%。.
美國勞動力市場的韌性以及油價飆升引發的通膨擔憂,完美地為黃金加劇的看跌勢頭創造了條件。.
展望後市,由於美元對日圓匯率再次逼近 160.50 關口(官方曾在 4 月下旬在此水平進行干預),黃金交易員密切關注中東局勢發展以及潛在的日本干預風險。.
總體而言,展望未來,貴金屬的波動性預計仍將居高不下,賣方可能會藉機大舉賣出,而「逢高賣出」的交易將佔主導地位。.
在日線圖上,XAU/USD 報 $4,307.05,由於現貨價格持續盤踞於所有主要移動平均線之下,空頭走勢得以延續。 21日簡單移動平均線(SMA)約位於$4,526.82,50日SMA接近$4,623.59,100日SMA位於$4,792.32,甚至更長期的200日SMA位於$4,436.55,均位於價格上方,強化了偏向下行的結構,儘管相對強弱指數(14)正滑向30點區間的低位,暗示可能出現超賣狀況,而非已確認的反轉。.
在上行方向,初步阻力位由位於 $4,436.55 的 200 日均線所界定,而位於 $4,526.82,以及位於$4,623.59的50日均線,共同形成後續阻力區間;而更高處的100日均線位於$4,792.32,則標示出更遠的阻力關口。 由於現貨價格下方缺乏鄰近的移動平均線支撐,在買方至少能收復200日均線並開始緩解沉重的技術面壓力之前,該金屬仍容易面臨進一步下行風險。.
分類
最近的
XAU/USD 在進入聯準會週之際維持看跌傾向
黃金/美元正處於關鍵時刻,因為中東衝突正在擴大
油價續漲,強勁復甦恐面臨阻礙
喜歡這篇文章嗎?分享它!
準備好交易了嗎?
立即開通您的Maxain帳戶釋放您的交易技能!
方便快捷入金& 出金方式
無任何出入金手續費